


In this trading guide, you will learn how to trade descending triangle patterns like a seasoned pro. In the world of technical trading, there are many different patterns to be aware of that will allow you to make smarter trading decisions. Once you master the descending triangle chart pattern, a simple chart pattern, you will gain a clear understanding of what is happening behind the price action.
This simple chart pattern can be seen on both long-term charts and short-term charts. It doesn’t matter what your trading style is; whether you are a swing trader or a day trader. Anyone can use descending triangle technical analysis to spot profitable trading opportunities.
In this article, we will explain the need for a descending triangle and how to determine it in real time. We’ll also cover the psychology behind the descending triangle reversal.

Descending Triangle Pattern
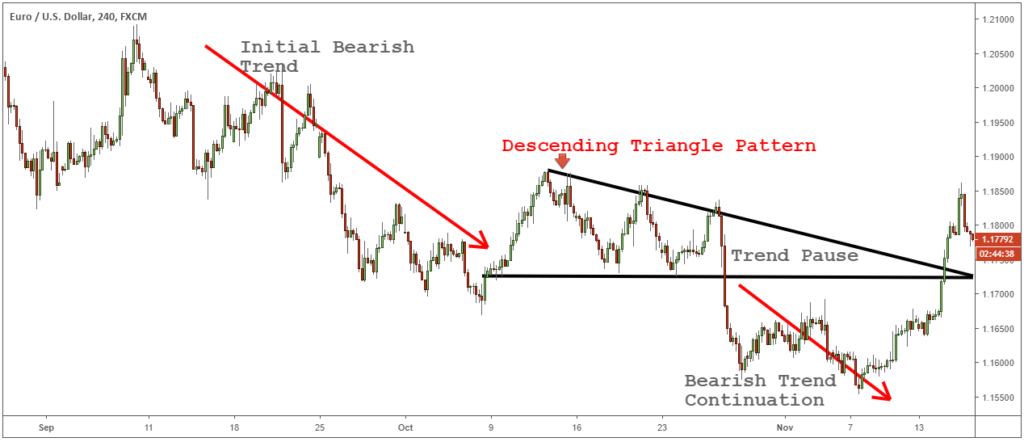
The descending triangle pattern is a continuation chart pattern that develops in the middle of a downtrend. However, in some situations, this can play out as a descending triangle reversal. Also known as a bullish descending triangle pattern.
The descending triangle stock pattern is a versatile chart pattern that is seen as a continuation pattern and a reversal pattern at the same time.
The reverse version of the descending triangle is the ascending triangle pattern we’ve talked about a lot.
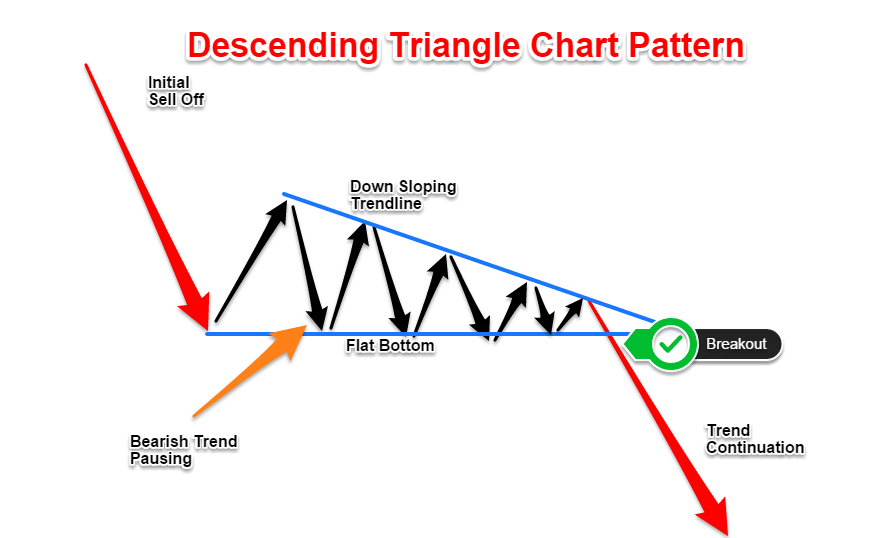
The main characteristics of the descending triangle pattern are:
- Flat support line.
- A downtrend line that connects a series of lowers.
- Flat support lines and downtrend lines converge to a single point.
Imagine that, above the descending triangle chart pattern, there is a downtrend consisting of a series of low highs connected by a trend line that tapers down. At the bottom, there is a solid support floor that is tested at least 3-4 times. A support level is the bottom from which the price cannot push lower.
Below you can see the ideal triangle chart setup:
As we mentioned earlier, this chart pattern operates on the one-minute chart, the five-minute chart, all the way up to the higher time frame. Whether you are flipping or moving trades, you can use them with a variety of assets. This includes individual stocks, global indices, commodities, Forex, or cryptocurrencies.
The psychology behind this pattern can be explained by the fundamentals of supply and demand imbalance. You can view descending triangle technical analysis as a pause in the downtrend. It is easy to understand how demand can dry up during the development of the descending triangle.
This compression to weakness is what creates a bullish pattern.
Remember: all continuation patterns, such as bullish flags, rectangular patterns, etc. that you find on our Trading Strategy Trader website, must have a trend context.
In the next part of this trading guide, you will learn how to trade a descending triangle. Let’s see if we can get some trading ideas from the bearish triangle breakout.

Descending Triangle Reversal
First, let’s examine the case of a descending triangle reversal. Usually, descending triangles are stronger when traded in the context of a trend. It is also stronger when traded in the direction of the current trend.
However, a descending triangle reversal pattern can potentially reward you with bigger profits if traded in the right context. We only trade descending triangle reversal patterns when this price formation develops at the end of an uptrend, and in the context of an uptrend.
Reversal chart patterns appear when buying activity declines and the market fails to make new highs. This suggests that the supply-demand imbalance shifts to sellers as buyers become weary.
In this case, we will be looking for a flat bottom for the bears to capture. A potential support breakout could signal a strong trend reversal.
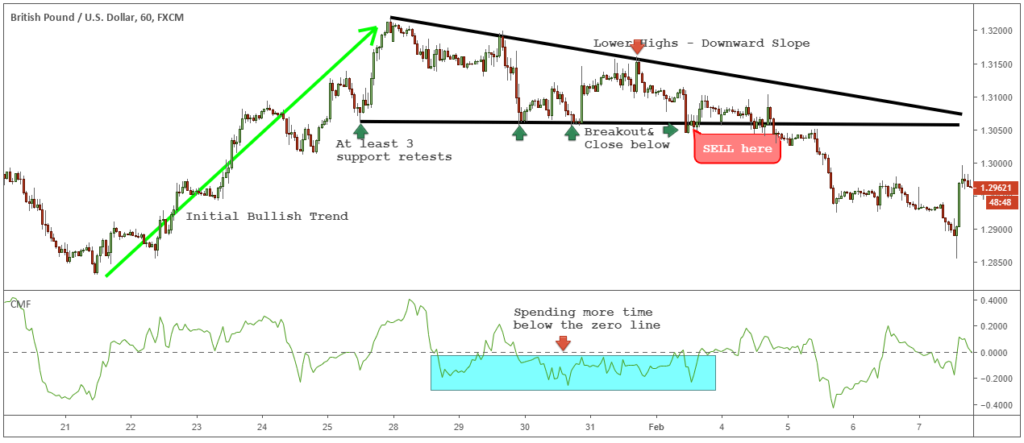
Let’s look at an example of a day trading opportunity to catch a reversal using a descending triangle on an intraday time frame.
When trading a descending triangle pattern, we always look for breakouts of support to give us potential entry points. Unlike textbooks that teach retail traders that support or resistance levels will be stronger if we have a lot of recovery; the opposite of which is true.
Note: The more support levels are tested the weaker they become.
In addition, a sailing candle must also produce a flat bottom for a valid trade setup.
But, that’s not all.
We need to take a step forward and confirm the breakout by using the Wang Chaikin Money flow indicator to confirm the supply-demand imbalance. The reading we get from Chaikin’s Money Flow will tell us if the seller has stepped in or not.
You just need to check if the Chaikin Money Flow line spends more time below the zero line during the appearance of a descending triangle. A reading below the zero line indicates selling pressure.
See the daily chart below:
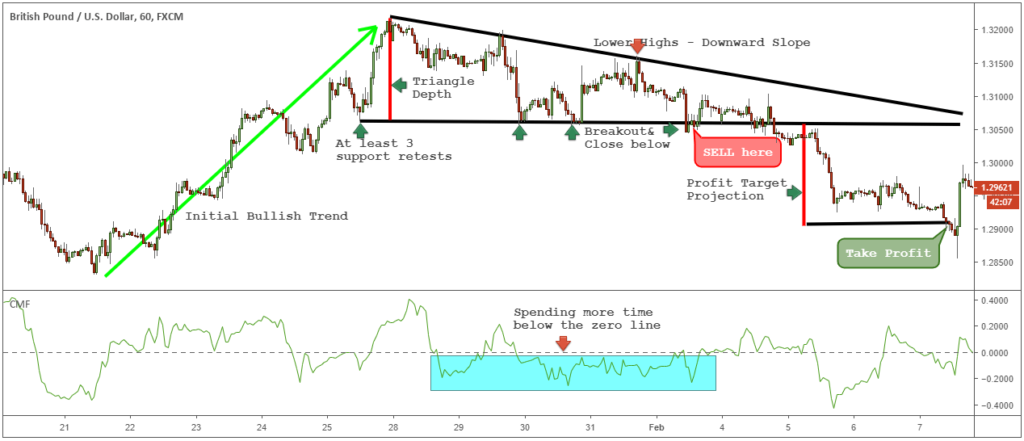
For our exit strategy, we will use one of our favorite trading techniques. Instead of focusing on static and random profit targets, we will use price action dynamics to get more accurate profit targets.
To get the profit target we just measure the depth of the triangle. Count how many pips there are from the flat support line to the highest point of the triangle. Once you have that measurement, point to weakness starting from flat support levels.
See the chart below:
You can see how the projected triangle depth measurement becomes a very accurate profit target. This is a great exit strategy that can maximize your profits.
Now let’s pause for a moment and look at how to trade the right way a descending triangle is a continuation pattern.
Descending Triangle Trading Strategy
It is important to remember that the descending triangle chart pattern is traditionally used to anticipate a potential breakout in the direction of a downtrend. In the following example, we will combine a descending triangle with the power of a technical indicator.
Using the Wang Chaikin trend indicator, along with a descending triangle breakout creates a very powerful trading strategy. One of the key features, unique to the Wang Chaikin trend indicator, is its ability to measure buying and selling power.
Most retailers struggle to measure the supply and demand equation in the market. You can solve this struggle by switching to Chaikin’s Money Stream.
In this strategy, the trader only needs to look at the agreement between the support breakout and Chaikin’s Money Flow reading. When a bearish triangle breakout occurs, we should have the Wang Chaikin trend reading below the -0.2 level.
The profit target projection is based on the same exit strategy we used previously. Measure the depth of the triangle and project the same price distance starting from a flat base.
Conclusion – Descending Triangle Chart Pattern
Trading involves risk and hard work. Make sure you first recognize the triangle pattern pattern before you make any real money with this chart pattern. Stop looking for the Holy Grail and learn how to trade like the pros do. Use simple trading tricks that are very powerful when used in the right context. Be sure to read the latest article on Technical Analysis Strategies.
The descending triangle graphic pattern can be combined with your preferred trading strategy. Once you learn to identify and train your eye to see it in real time it will help you better understand price action. The supply and demand imbalance inside a descending triangle reversal will almost always generate a fast and furious disruption.
Also, be sure to learn about the Symmetrical Triangle Trading Strategy.
Feel free to leave any comments below, we will read them and will respond.