Forex Trading
Forex trading (also ‘foreign exchange’ or ‘FX’) is the buying and selling of one currency for another. Trades are placed based on exchange rates listed over the counter (OTC) or exchange trading platforms.
The market is the largest in the world, seeing more than $5 trillion in trades every day. Forex can be traded five days a week, around the clock. There is no central exchange for currencies, so they are traded around the world on various sources.
In each currency pair, the first currency listed is the ‘base’ currency, and the second the buy currency. So with the EUR / USD price mentioned how many US dollars will be needed to buy 1 Euro.
Almost any financial news, or global event, will affect the price of foreign currency exchange. With markets available 24 hours a day and many brokers offering low commissions, tight spreads and high leverage, forex trading has become very popular with retail investors. However, it is high risk, especially where leverage is involved.
How Forex Pairs Work
Forex pairs are the starting point for forex trading. A ‘pair’ is two currencies to be traded. So a trader will buy one currency, use another. So for example, with the GBP / USD pair. Traders will buy pounds, using US dollars.
When the price is quoted, they are always the second currency, buying the first. So with EUR / GBP for example, the price quoted is the cost in pounds, to buy 1 Euro. Note however, that the decimals will move, making the prices look a little strange to anyone used to changing currency for their vacation. In the EUR/GBP example, the current trading rate is 8454.8. For vacation makers heading to Europe, that equates to 84.5 pence buying 1 Euro.
The currency of the trading account is not important, the broker will change them as needed to enable the trader to buy or sell currency. Retail forex trading is simply speculating on the movement of exchange rates between forex pairs.
Established pairs, traded in high volume and based on the US dollar, are known as ‘major’ pairs. In addition to these more traditional forex currency pairs, there are quickly becoming a wider range of currencies to trade – these are referred to as ‘minor’ or ‘exotic’ pairs. Binary options brokers currently offer options between 40 and 50 different currency pairs from around the world. The evolving market has added a new element to Forex trading. These markets include areas such as South America and Asia. A currency often represents market confidence in the overall economy of the area concerned. Given the various factors that contribute to such an economy, it’s easy to see why prices fluctuate constantly.
Small and exotic pairs however, see lower trading levels, which can affect volatility, but also availability at certain times.
What are exotic forex pairs?
- TRY – Turkish Lira
- NOK – Norwegian Krone
- SEK – Swedish Krone
- HKD – Hong Kong dollars
What Influences the Forex Markets?
So what affects the FX market? Pretty much everything . Almost every global news item can have an imaginable impact on currency prices. For example, a drop in oil prices causes a corresponding drop in the value of the Russian ruble. An economy that is heavily linked to oil will rise or fall with the value of the commodity. There are additional factors to consider, but the example is clear.
A more subtle example is the Indian rupee. The new governor at the Reserve Bank of India boosted investor confidence in the recovery plan set for the Indian currency. The confidence is reflected in the strong performance of the rupee. While the Indian currency benefited directly, other Asian currencies also surged higher, with regional performance a factor helping both the Philippine peso and the Thai baht.
Another example is foreign policy. If a country like China to make an agreement with Russia through gas, both currencies can benefit. If the market believes one trading partner has the better side of the deal then one currency can gain while the other suffers. Traders can take a look at the upcoming foreign policy and invest accordingly. These examples are some of the more obvious and larger market drivers, but illustrate the fact that forex is a very complex market.
Volatility in the Forex market
Uncertainty in the market usually leads to volatility. The global economy is certainly volatile right now, which means there are plenty of opportunities for Forex traders. Binary options provide an opportunity to profit from uncertainty. The range of forex currencies available to trade through a binary options broker has never been greater and the right strategy, for the right currency, can prove very profitable. Our review highlights brokers that focus on binary options exchange rates.
Forex Market Opening Hours
Some beginners skip some of the forex basics and head straight for the strategy. That can be a mistake, and lead to many lessons learned the hard way (losing trades). One of those ‘basics’, is knowing the hours when certain markets will open.
The open point exchange market is open 24 hours a day. This is because banks and corporations open at different times around the world. This demand provides liquidity to forex pairs. But each hour of the day has a different bias based on what part of the world is open for business. Understand the hours of the forex market, and the hourly trends, and you will be able to apply your strategy at the right time.
Forex Market Session
The main market is open at different times throughout the day. Which market is open directly affects the liquidity and volatility of the forex pair.
For example EURUSD is most liquid and volatile during the London and New York sessions, especially during the “overlap” period when London and New York are both trading.
USDJPY typically has the most pullbacks when Tokyo first opens, and when New York opens a few hours later.
A currency generally sees increased liquidity when one or more markets that are actively trading, or using, the currency are open for business.
Charts do not show every market in the world. But what is shown is the main forex market. The Canadian market opens while New York opens, and London overlaps with other European markets.
Germany opens an hour before London; Therefore, some consider that to be open, and not the beginning of the London session. Volatility, on average, didn’t see much of an increase until the London open though.
Intra-Day Volatility
Those main sessions directly affect the volatility of currency pairs. Hourly volume changes follow certain trends. If your strategy is based on volatility or you use a trend strategy, focus on the time of day where price moves are the biggest.
If you use more trading strategies, or prefer low volatility, trade during quiet hours. Check where the chart shows the drop in hourly volatility.
08:00 to 17:00 GMT provides the best trend opportunities, with 13:00 to 17:00 generally providing the biggest moves.
Those looking for reduced volatility, or times more likely to be quiet, trade between 20:00 and 05:00 GMT.
USDCHF is very similar to EURUSD in terms of hourly volatility structure, although USDCHF moves less daily and therefore the overall hourly volatility is a few pips less.
NZDUSD has the same hourly volatility as AUDUSD, and both move about the same amount each day.
Opening Time Summary
Learning the basics, like what market sessions and hours mean to you as a trader, can help with strategy and timing. No matter what time frame you’re trading, create a checklist that helps you determine what type of market you’re looking to trade. Don’t try and ‘force’ a trade. This will also help with filtering trades and cash payments on good opportunities.
Forex vs Binary Options
The main advantage of Binary Options for Forex Trading is the defined and limited losses that can be imposed on any trade. When you buy Binary Options you know in the beginning, what your maximum loss is. It is defined by the cost of the option itself. You can also determine your Forex trading loss by adding a Stop Loss order to your position, but two things can then come into play;
- A volatile price breakout against you where you plan to stop your loss after, for example, 30 pips, but you end up being stopped after more than 30, due to market volatility.
- Try to move your Stop Loss as the market closes because you feel the momentum will not last. In the end this will cause you to lose more than you initially thought at risk in the trade.
In other words, it can eliminate the need for disciplined risk management. Often traders end up trading emotionally which will end up being a disaster. With Binary Options your maximum loss is always fixed and there is no risk of losing more.
This is also related to the concept of volatility, with Binary Options not really caring how the market moves as long as it ends up in the money at expiration, whereas having a Forex position often sees you take losses as a result of that volatility. market high – to then see the price move back in your favor.
Although both trading methods share many common characteristics, there are additional elements that set each one apart:
- Leverage. Binary options are usually offered without leverage. Traditional Forex often provides large ‘gearing’. Leverage is a double-edged sword. Some traders will demand the additional profit potential it provides, others will be concerned about the losses that can result from leveraged trading.
- Risk. Risk and reward are clear to begin with with binary options. The best and worst case scenarios are both known. In more traditional forex, profit or loss may not be clear until the trade is closed. Leverage magnifies this problem.
- Capital requirements . Traditional forex requires more cash from the account than binary options.
- Flexibility. Binary options can provide Touch and Range options in a simple way. The same trading profile can be achieved with conventional forex trading, but it requires more thought on the part of the trader.
- Fixed Period Expires. Forex traders can move in and out of trades without a definite end point on either of them. Binaries require a certain expiration to be set at the start of the option.
- Monitoring. Binary options can be left to mature at expiration, with no additional risk. Forex trading needs to be monitored as there are sharp price movements that may trigger losses or similar. Binaries will of course, be traded along as well, so some traders may prefer to monitor binary positions as well.
Trade Speed
Binary Options allow very short expiration times. A claim of only a few minutes can be found, even a moment of sixty-two years. In forex, it is very rare that the market will move enough for you to close your position in minutes let alone sixty seconds. As payouts for Binary Options range from 75% to 90% you can buy an option of say, £200 and receive a profit of between £150 and £180 after just a few minutes.
Distance to Target
With Forex trading, you enter a position with the goal of a price level that reaches a certain target that will inevitably be far from the current price. Binary Options allow the target price, the strike, to be in the money, creating a higher chance than an Option that is in the money at expiration. With the forex target price potentially far from the current market price, a larger price move is required to gain the same level of profit.
In Forex if the current market price for EUR / USD is 1.1200 you enter a trade with the idea of an up or down market, say 20 pips, whereas in Binary Options the strike price will be the current market price of 1.1200 and your option must be above or below that price even if it’s only 1 pip for you to cash out.
Forex Advantages
The biggest disadvantage when trading Binary Options is the required win rate. In Forex trading if you use the risk / reward ratio correctly then your individual profits will usually be higher than your losses. This is because you need to enter each trade with a higher Target profit than the Stop Loss, for example 35 pips against 25. This means that even if you are only 50% of the time you need to be, your winning Trades will make more than your losing trades.
This concept does not work for Binary options and it is easy to see why. With payouts around 75-90%, traders must win more than 50% of their trades to be profitable. With each individual trade, more funds are at risk, than will be won if the option is out of the money. In this scenario, you need to earn more than 50% of the time to return the total profit.
Also, with binary trading there is no real secondary market. Once you have bought an option, you may want to exit the position before expiration – you may be trying to minimize your losses or maximize your profits if you think the market is changing. Therefore, you may find yourself wanting to sell the option you bought. To do that, you only have the option to sell it at the price the broker, where you bought the option, displays to you.
Although you can have multiple accounts with different Binary Options brokers and compare the prices of the options you want to buy before actually buying them, once you’re in a trade, if you want to exit it, it’s closing the trade before it expires , you have no choice but to do it at the price displayed by the broker. In Forex of course the market is priced for free at any time and you know you will get a fair market price to exit your trade and not a broker price.
To summarize the binary options vs Forex debate
Which trading option is the best which is the most profitable market to trade? Binary options or Forex? This really depends on your own commitment in terms of hours a day in front of the screen and discipline in risk management.
With Binary Options you may not need to be in front of a screen for hours a day to follow the market continuously as you need to when trading Forex. You can take your position and wait for the outcome confident that your maximum liability is the cost of the option. You don’t have to worry about maintaining your stop loss, it is fixed at the price you paid for the option and cannot be changed.
One thing that both markets have in common is the analysis required to make trading decisions. Any market you will be trading in you will always be looking at Fundamentals and/or Technical Analysis. For both markets, you need to hone your analytical skills and create a profitable trading plan or strategy.
Fundamentals of Forex Binary Options Trading
Here, a professional trader, and founder of a money management and trading advisory firm, shares his thoughts on the basics of forex binary options trading and the system he personally uses.
The strategy below is not a secret but it is also not known either. That simplicity is the reason for its success.
EUR / USD
The currency pair I am announcing is the EUR / USD pair. This is because it is the most volatile – but also predictable – of the forex pairs. It remains the most traded pair since the opening of the Forex market to retail investors. Daily numbers have been increasing since the early days. EUR/USD is also a pair used by financial firms to hedge against market changes.
A frequent crop issue on binary options forums, is the amount of different strategies discussed or offered. The majority of traders think that the more complex the system, the more profitable it is. When these forex strategies fail, the system is blamed. The real issue however, is behind the screen. No strategy will adapt to changing market conditions; traders must adapt.
Many will argue that this strategy will not work in certain market conditions. However, is the market is binary; prices will only go up or down. The startup market doesn’t actually exist. Any system has the same goal – to detect the best entry and exit points for any given trade.
For example: Experienced traders will detect support and resistance levels easily. A beginner might not. The same beginner investor might use a strategy using:
- Stochastic,
- MACD
- RSI …
… but what they fail to see, is that these pointers give him the same entry point used by experienced traders.
When trading forex binary options, spotting the best entry points and knowing the next price move is key.
Note: The following are personal opinions and strategies that I personally use. Everything should be read carefully. Don’t jump into high-risk methods without fully understanding how the strategy works. Consider trading with a demo account before risking real money. Be prepared to pass trades if something gets in your way. Don’t force trades where there aren’t any, opportunities will come.
Forex Basics
The first point is to offer an explanation of the forex market in general: Currency exchange is governed by the laws of supply and demand.
Here is a hypothetical example: Apple (a US-based corporation) sells 1 million mobile phones across Europe, at a price of 500 euros per product. EUR (€) is the base currency. They use HSBC for clearing, so these funds are received there. However – Apple reports in dollars, and their administrative account is with BOA.
So Apple made €500m sitting in an HSBC account in Luxembourg. The funds now need to flow into their BOA account and be converted to USD.
They now have to exchange currency. Transfer orders come on Tuesday at 4pm UK time. It will not be transferred immediately. Banks will collect all their USD orders at night. This may have been up to a month ago.
The UER / USD pair traded on Wednesday morning at 6 GMT at 1.27000. So Apple’s account with BOA will receive 635 million USD at 8am EST. This order is set at 1.27000. How do banks – or retail investors – make money from these transactions?
How do Investors Profit?
BOA will obviously get a commission from Apple, but what about HSBC?
At 8 am GMT – the opening of the London Market, liquidity was 380 million euros. The price is 1.27010. So 500 million euros is equivalent to 635 050 000 USD. Currently, the market cannot handle this trade.
Extending the hypothetical example, here is how the market is viewed. The Euro outlook is bullish. Asian markets rose overnight. The US fiscal cliff is getting resolved. Millions of investors and retail stores take BUY orders and place stops 10 pips below the current price. There is now a liquidity exposure of 300 million euros plus current liquidity of 380 million euros. Total liquidity then, in USD on the market at the moment is (1.27010) 482 638 000 USD and 381 030 000 USD is pending (equivalent to stops).
Currency Exchange
Market data shows that stop at 1.26910. Therefore, at 8.15 am GMT, the order came to SELL available liquidity (840 Million Euro sell order). The effect of this is to push the price to 1.26905. Now, the bank’s BUY order is triggered. Other retail investors are now placing new buy orders to cover their losses.
The price is 1.27099. Here, we may exit our BUY position gradually (assuming we follow the bank trades). Because the trend still looks strong, people buy our orders. On the chart this may be indicated by a green candle that is getting smaller in size after an upward trend.
Trade Revenue
So the market liquidity increases to 380 + 300 = 680 million euros. We exited at 1.27099 for a gain of 9.9 pips (from 1.27000). Once leverage is considered – and the sheer scale of these trades – huge sums of money have just changed hands. Banks (and retail investors) both use leverage to make huge profits from such moves.
This is just an example. Actually a huge trading volume (4 trillion USD daily). There are many traders, market makers and stakeholders in this market, but the example is to show you how FX works, and this is important when analyzing support and resistance (SR) levels and trends.
This level is determined by the larger players. They also hold firm as retail investors step in and use them. The smart money cycle occurs in 3 price cycles. We then see a short-term channel where price is stuck for a little bit of accumulated strength.
Forex System – Fibonacci
These price cycles are not random. They are in order. This sequence is defined by a set of numbers called Fibonacci numbers.
Fibonacci numbers were not developed for trading. They occur throughout the natural world, where many biological systems can be described in terms of Fibonacci-like sequences.
Major forex traders (including banks) do not use indicators such as RSI, CCI or MACD. They use a system based on Fibonacci numbers.
Combining Fibonacci with accurate price channel calculations and information on how other people trade, you have a profitable trading strategy for forex.
Forex Using Binaries?
Why should you consider all this when trading binary options? Unlike foreign exchange, you need to be more frequent. You need to identify direction, not step size.
During today’s trading, there will be no large trades shown above. I want bag (and pip) price movements, so I need to use something that finds price cycles and reversals. For binary forex (and day fx trading places) I use 3 indicators with very accurate functions.
Forex Correlations
Forex relationships are the main tool. If you don’t know what they have – It might have ruined your trade. Correlation shows which pairs move together. Also, it determines those who move in the opposite direction. No less important, it will show which pairs are not related.
This all helps to judge which trades we should take. It can reduce risk, and also provide additional business opportunities that are not obvious on the price chart.
How to Read Exchange Correlations
Correlations are usually displayed with values from -100 to 100. A value of -100 (inverse correlation) indicates two forex pairs that move exactly opposite each other. If one goes up, the other goes down and vice versa. The number 100 means that two forex pairs are moving together. If one goes up, the others go up too. Likewise, if someone falls, so will it. Numbers at the extremes of the spectrum are rare – but the closer the number is to -100 or 100, the stronger the correlation.
So the figure above – / + 70 is a correlation that needs attention. Anything over – / + 80 is a strong correlation. Consider the GBP/USD and EUR/USD crossovers above. It gives a figure between GBP/USD and EUR/USD of 89.6. This shows a strong correlation.
Next, judge USD/CHF with EUR/USD. It shows that the correlation between the two pairs is -95.4. This shows a very strong inverse correlation. When EUR/USD goes up, USD/CHF goes down, and vice versa.
With many pairs, there is no relevant correlation. Where the value (positive or negative) is less than 60, the correlation is not very strong. Anything around 0 indicates no correlation between pairs at all. For example, NZD / USD and EUR / USD pairs. The correlation here is -1.7. This means that there is no visible correlation, on a daily basis, between these pairs. In other words, the rise or fall of NZD / USD tells us nothing at all about what EUR / USD might do.
Correlation Flood
Correlation tables are created and updated based on time frames, daily and weekly tables. All of these timeframes provide valuable information depending on the timeframe you are trading. For short-term trading, hourly and daily correlations will be most important. Numbers change, so don’t take the above as gospel.
Why does Forex Goal happen?
There are many reasons to care about forex correlation. The biggest reason I monitor them is to control risk. For example, a trader may think that trading multiple pairs has offered them diversification. Just by knowing the pairwise correlation, can this be guaranteed?
If you go long (buy calls) in EUR/USD, GBP/USD and sell (buy puts) USD/CHF you have basically taken 3 very similar positions. If someone moves towards you, they will probably move against you. The risk has tripled. If leverage is also used, the risk is huge.
Another reason why forex correlations are important, is that they can give you trades that you might not otherwise see. For example, you believe the EUR will appreciate against the USD (ie EUR / USD will rise). You look at the charts and don’t see great trade setups. Since you know that GBP/USD usually moves with EUR/USD (based on the current correlation), you can also check GBP/USD to see if there is a better trade.
You may also want to see if there is a trade set to go short (buy puts) in USD/CHF as it usually moves in the opposite direction of EUR/USD. A high correlation (positive to negative) gives you an alternative trade; choose the one that has the best trade.
Confirm trade
I also like to use forex correlation to confirm trades. When looking for forex pairs with a high correlation, I will use one pair to confirm trades on the other side. For example, if EUR/USD goes up, and I want to go long (buy a call), I also want to see GBP/USD go up. Since this pair is highly correlated they need to move together. When they don’t, it warns me that maybe I need to take a closer look at my trades. This doesn’t mean I won’t take trades. This relationship changes and the two couples never move perfectly in harmony. It means I better have a very good reason to take the trade (as you always should).
Correlation can be a tricky statistical topic. Hopefully this introduction gives you enough concepts to do a little homework on your own. Check for frequent correlations to be aware of relationships between forex pairs that may affect your trading.
Use correlation data to control risk, find opportunities and filter trades. If you have trouble seeing how the correlation works, try looking up the numbers in the correlation table and then pull up a price chart of the two forex pairs in question. Notice how the pairs move relative to each other; doing this will help establish a general understanding of the correlation.
Swing Trading – Definition and Examples
“Swing” trades are usually trades that are open for one to five days. A trader is trying to follow the price momentum of an asset, usually within a defined trend channel.
The idea of “swing trading” originates from the stock market and is a type of trading strategy followed mostly by retail traders. The reason is that it is difficult for institutional traders to place positions of the type of size they need without moving the market.
This is not necessarily true for the Forex market as the Major pairs are all very liquid, and there is a vast interbank market. Traditionally the trading position swings itself in terms of time period between day traders and medium term investors or traders. Day traders will hold positions for a few seconds or hours at most while medium-term investors can hold positions for weeks.
However, the forex market is a very different kind of ball game. Even in the most raging bull trend or the most violent trend, you can still see the day’s price action has gone through several highs and lows, rather than heading in one direction for the entire day.
Swing traders in the Forex market can also be day traders, trying to take advantage of downward and reverse price momentum. Their mission is to enter the market while the momentum is rising to the upside but to exit the moment the market turns downward again.
What is the analysis behind the Swing strategy?
Swing traders, also due to their short holding periods, are not very interested in fundamentals and are mainly focused on technical analysis. It could be something as simple as a 3-day moving average crossover strategy, tweaked to enter and exit the initial position. Or a more complicated mix of various technical indicators that emphasize each other.
However, the intention is the same, to get early when the momentum changes and to turn the position around when the market returns. Therefore, this strategy works best when the market is oriented in a horizontal direction instead of up or down. The Forex market has many changes even when the market has a clear trend, but trying to sell in a strong bull market early enough to catch the swing may prove painful.
Determine the right market
Determining whether the market is currently suitable, within a given time frame is critical to the success of this strategy. You need to consider the time you are trading, in the Forex market exchange takes place over a relatively short period of time. Therefore, it is necessary to stick to the time horizon you are trading to determine if the market is trading flat. A sideways market is defined when the high and low do not cross the previous high and low, giving rise to a channel known as another chart pattern.
The shorter the time period the smaller the difference between highs and lows, or the shorter the price action channel. For day charts, you can expect most majors to drift from trends that have between 2% and 6% wide channels. For comparison, if you look at the channel hour chart it might be more like 0.5% to 1.5%. Often sideways markets in less than a day can move in very tight ranges as the market consolidates new levels.
Let’s look at some examples
The hourly candle chart in the first image is for USDCHF. As we can see, the pair went through a rather tight price range of around 45 pips, between 0.98800 and 0.9925. The blue triangle that runs from May 19th 06:00 am GMT to May 24th 03:00 pm GMT, highlights how the channeled price action remains throughout that period. The swing trader then tries to go short or sell at points A, C, and E and go long or buy at points B, D, and F.
In swing trading, there is no time period; This strategy consists of going long or short continuously. Therefore, there is no close and wait period, which can be useful when the market moves you allowing you to return to the market at a better price than you exited. However, it can be painful if the trend is sharp and persistent.
Therefore, it is necessary to identify the breakdown of horizontal price movements, and the development of increasing momentum in one direction. From the chart above, it looks like the channel pattern has been broken. Three of the last four bars have closed above the blue square which should raise a red flag to swing traders. The sideways action is unlikely to turn into a new uptrend. However, the fact that the price moves above its channel should be done carefully. It will have to wait and see if the market has now found momentum baru or just the higher part to the channel.
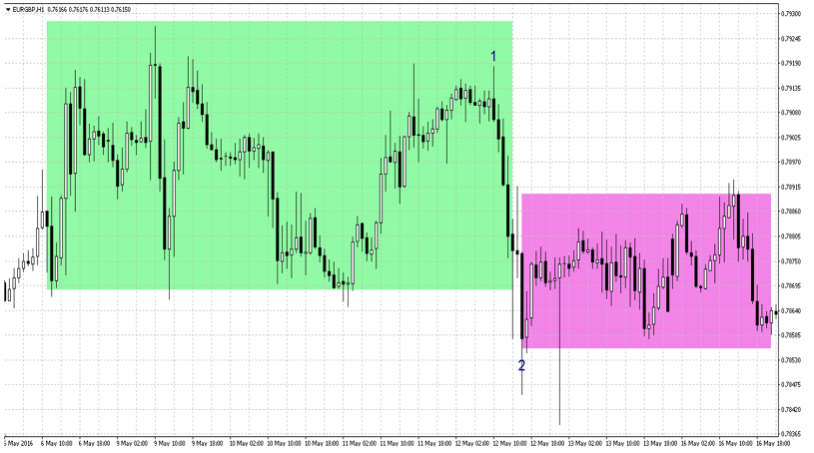
The hourly chart in the second image, for EURGBP, shows how price action moves from one lateral channel in the green rectangle to another lateral channel at a lower level in the pink rectangle. As the price moves from point 1 to point 2, it may be tempting to open a short position at point 2 with the view that a new bear trend is underway. Only to find that price is now headed back higher and trading in a range.
Finally caution should be used as always, but even if you are not a swing trader identifying a tilted market will help not get stuck in the swing. Correct identification of the market regime will allow you to avoid buying when the market will decline, or selling when the market will retrace.