


This Amazing Harmonic Pattern Trading Strategy will give you a new understanding of price action. Our team at Trading Strategy Traders knows the geometric patterns that can be found naturally. Similar anomalies can be found in financial markets, such as in harmonic patterns. This ability to repeat and create complex patterns is what makes Forex harmonic patterns so remarkable. We also have training for fractal trading strategies.
Harmonic patterns are complex patterns in the Forex market. If you want to start with a simpler price action pattern, we recommend the Head and Shoulders Price Pattern Strategy.
We can distinguish six basic fundamentals of Forex harmonics:
- Gartley Pattern – developed by HM Gartley, this pattern is the most frequently used in the harmonic trading community. By using the Fibonacci ratio, the Gartley pattern aims to identify breakouts, resistance, and support. This pattern is characterized as an uptrend, followed by a small reversal, followed by a smaller uptrend, and completed by a larger reversal (forming an asymmetric “M” or “W” shape).
- Butterfly Pattern – there are two types of butterfly patterns; descending butterflies and ascending butterflies. Like the Gartley pattern, this pattern is designed to reveal when a trend reversal is stronger than the original trend. Using the triangle created in the butterfly, traders can determine whether holding a short or long position is the most profitable.
- Crab Pattern – the crab pattern is ideal for traders trying to identify accurate price movements. It allows traders to maximize returns on securities with low volatility. The crab pattern is similar to the butterfly pattern but thicker. This makes it possible to record smaller movements.
- Bat Pattern – when compared to other patterns, the bat pattern is still trapezoidal, but more symmetrical. For both bearish and bullish patterns, the right and left sides will be almost equally high.
- Shark Pattern – the shark pattern is one of the newer harmonic trading patterns and has been used since 2011. The pattern uses a similar five-leg reversal sequence. The steep outer row and dip in the middle make a chart that resembles a dorsal fin. This is how the shark pattern got its name.
- Cypher Patterns – cypher patterns are advanced trading patterns that combine Fibonacci trading with other indicators (such as RSI). The cypher uses a stricter Fibonacci ratio (usually less than 1), which results in a “steep” visual appearance.
Each of these patterns will help you effectively issue stop losses and trailing limits. To get a more comprehensive view of the market, it is useful to monitor multiple harmonic trading patterns at once.

There are many benefits of harmonic trading. For example, if you become an expert in one of the Forex harmonic patterns, you will know how to trade it on a particular pair. You will be able to know when the best time to trade is and when the market will react in a certain way.
You will become an expert in Forex harmonic patterns. A useful tool for trading this strategy is a harmonic pattern scanner or dashboard that shows all the patterns on different instruments. However, we recommend that you study the pattern well before using the scanner or dashboard.
Our favorite time frames for Amazing Harmonic Pattern Trading Strategy are 1h, 4h or Daily charts. For the sake of simplicity, we will refer to the Amazing Harmonic Pattern Trading Strategy as the AHPT trading strategy. We don’t want to go to lower time frames because, after extensive backtesting, we found the Amazing Harmonic Pattern Trading Strategy works better on higher time frames.
If you want quick profits, check out our favorite day trading strategy, Best Stochastic Trading Strategy – Simple 6 Step Strategy. It may be more suitable for your own needs. This strategy does the same and is suitable for trading other asset classes such as stocks, futures, options, etc.
Throughout this article, you will learn the effectiveness of this pattern’s strengths and weaknesses. You will also learn how to efficiently Forex harmonic patterns. This ability to repeat consistently makes Forex harmonic patterns attractive to our team at Trading Strategy Guide. We also have a tutorial on how to trade with the Gartley pattern.
Before we start, let’s see what indicators we need to successfully trade the Harmonic Pattern Trading Strategy:
If you’re not that great at geometry most standard Forex trading platforms come with a harmonic pattern indicator. This can help you see and measure Forex harmonic patterns. Forex harmonic patterns use Fibonacci numbers to determine the right trading points.
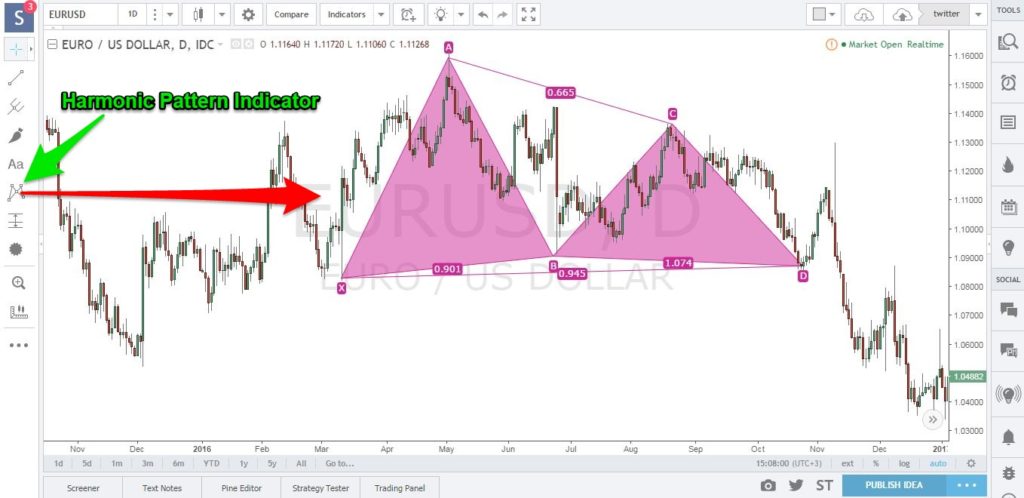
TradingView Platform: Harmonic Pattern Indicator
The harmonic pattern indicator allows you to call market turning points with high accuracy. See Price Borrowing Bar Trading Strategy if you have no knowledge of what a reversal trading strategy looks like.
Now let’s jump into the rules of the AHPT trading strategy.
Note *: Going forward, we will focus on the Butterfly harmony pattern. This is one of the most common Forex harmonic patterns.
What is the Butterfly harmony pattern?
In technical analysis, the Butterfly harmony pattern is a reversal pattern consisting of four legs. Legs are swing wave movements that connect and consist of high swings and low swings. Here’s how to recognize the right swings to increase your profits.
Summary of the rules of the butterfly harmony pattern:
- AB = 0.786 or 78.6% of swing leg displacement XA;
- BC = minimum 38.2% – maximum 88.6% swing leg AB;
- CD = minimum 1.618 – maximum 2.618 feet swing AB;
- CD = minimum 1.272% – maximum 1.618% swing leg XA;
Determine the Butterfly harmony pattern.
The Butterfly harmony pattern depends on point B. It defines the structure and sets other measurements in the pattern to determine trading opportunities. To the B point Butterfly pattern, it must have an exact 78.6% shift from the XA swing. Other regulations that further redefine the structure include the BC projection which must be at least 1.618 measurements.
Also, the Butterfly pattern must include an equivalent AB = CD pattern. It is a minimum requirement. However, the alternative 1.27AB = CD is more common for this structure.
The 1.27XA projection is the most critical figure in the potential reversal zone. And, finally, point C must be within the range of 0.382-0.886 attractor.
You can start drawing the butterfly pattern once you have the first two legs of the pattern. Once you have X, A and B points, you can start monitoring price action. You can find confirmation that wave C obeys the rules of the Butterfly pattern.
Amazing Harmonic Patterns Trading Strategy Rules
Now is the time to reveal the rules of the Amazing Harmonic Pattern Trading Strategy. We’ll start with the most interesting part. This is always the entry point and continue with the rules for stop loss and take profit orders.
There is one important thing we need to learn before defining the Harmonic Pattern Trading Strategy rules. This is to give you a hint on how to apply the Harmonic pattern indicator.
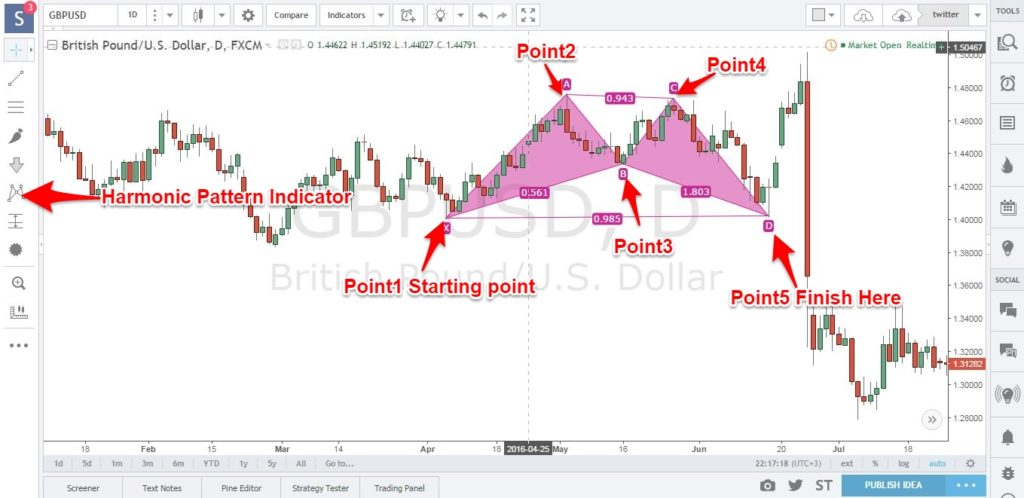
Step #1 How to use the Harmonic Pattern Indicator
I will walk you through this process step by step. All you have to do is follow this simple guide. See the picture below for a better understanding of the process:
- First, click on the harmonic pattern indicator which can be located on the right sidebar of the TradingView platform. In the MT4 terminal, you can find the harmonic pattern indicator in the Indicators library.
- Identify on the chart the starting point X, which can be any swing angle or low on the chart.
- Once you are at your first swing / low, you just need to follow the movement of the market swing wave.
- You need to have 4 points or 4 swing high / low points that tie together and form a Forex harmonic pattern. Each leg of the swing needs to be verified and adhere to the rules of the harmonic pattern strategy as stated above.
Now, we will give the entry rules for the bullish Butterfly harmonic pattern.
See below…
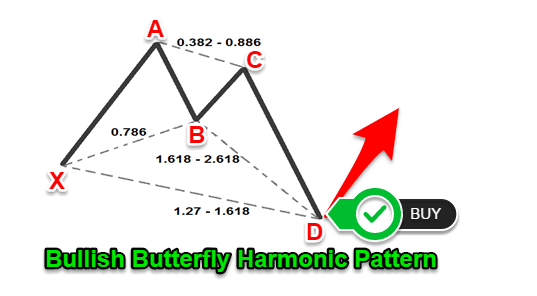
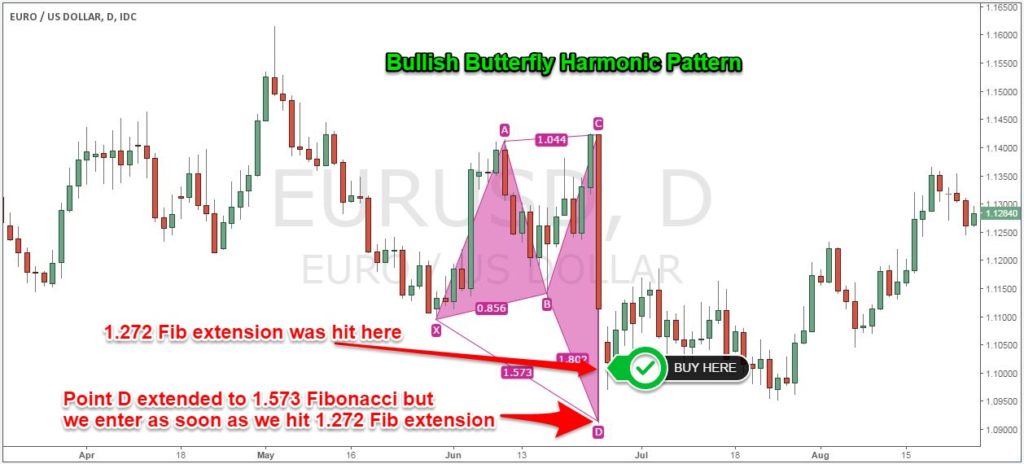
Bullish Butterfly Harmonic Pattern – Buy Entry
Ideally, as a trader, you want to enter at point D resolution. As we did earlier, point D of the Forex Butterfly harmonic pattern can develop anywhere between 1.27-1.618 Fibonacci extension A leg. Since the market is not a perfect place, we will initiate a buy order when the market hits the 1.27 Fibonacci extension.
In the example above, we entered at the 1.272 Fibonacci extension, but we can already see point D extending to the 1.573 Fibonacci extension. This is still within the 1.272 – 1.618 range which confirms the bullish Butterfly harmonic pattern.
That’s still a great entry level.
Where to place your protective stop loss is the next logical question.
Bullish Butterfly Harmonic Pattern – Stop Loss
For the Bullish Butterfly Harmonic Pattern, you usually want to place your protective stop loss below the XA 1.618 foot Fibonacci extension. That’s a logical place to hide your trailing stop. This is because each break below will automatically cancel Butterfly’s harmonic pattern.
So far, we have determined the correct entry point and stop location for the Harmonic Pattern Trading Strategy. Now, it’s time to change our focus and determine where to take profits.
Bullish Butterfly Harmonic Pattern – Take Profit
Adding multiple profits with the AHPT trading strategy will further enhance your trading experience. and will affect the expected profit as this will almost guarantee that you will make a profit. Forex harmonic patterns, while they are reliable patterns, you want to be very aggressive with your profit targets.
As the saying goes: “No one is broke by taking advantage”
So where did you take your first partial profit?
See the picture below:
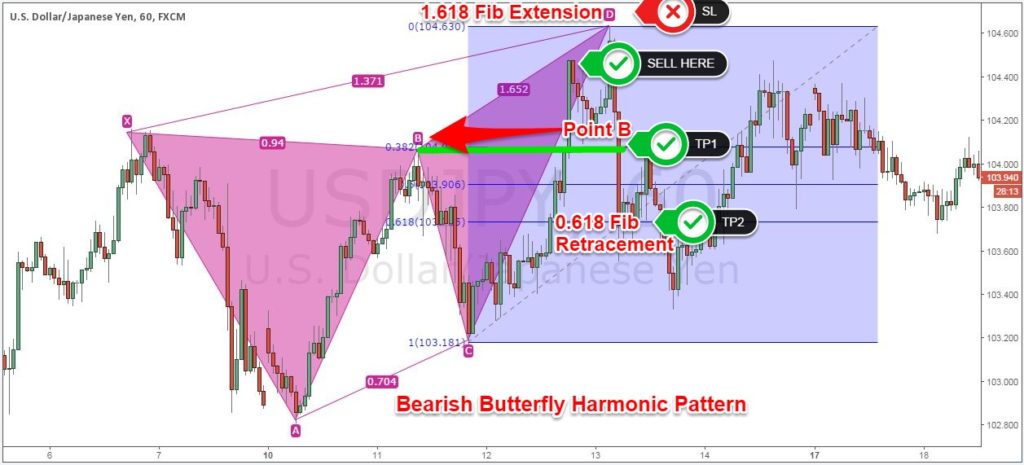
The Attractive Harmonic Pattern Trading Strategy has a more conservative first partial profit target established at Point B. Usually this is where you would expect to find some resistance on the way back as it is an important swing point.
We want to close the second part of our trade when we hit the 0.618 Fibonacci retracement CD leg. You can also target the repeat of point A. Although that can be the next target as you become more experienced with the harmonic pattern indicator.
Take a look at the chart below:
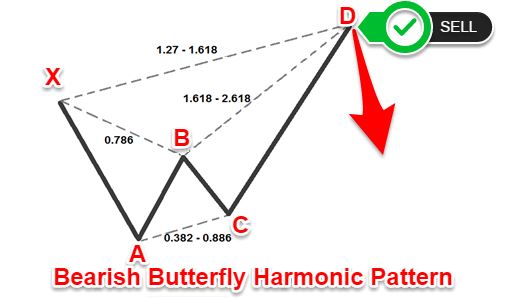
Note ** Above is an example of a BUY trade using the Harmonic Forex Butterfly Pattern. Use the same rules for the Harmonic Bearish Butterfly Pattern for the SELL trade. In the picture below, you can see an example of a real SELL trade. You can do this by using the Butterfly Harmonic Pattern.
Take a look:
Don’t be fooled if this chart may seem confusing at first glance. Study the rules above and you will find these trading examples follow the rules of the strategy perfectly.
Conclusion:
For all Forex harmonic patterns, and trading in general, accuracy is key. This is because we eliminate errors when we are as accurate as possible. The Harmonic Pattern Trading Strategy gives us the highest probability of success. The interesting thing about Forex harmonic patterns is that they identify areas where supply and demand are in focus. If you’re a fan of supply and demand trading, read Supply and Demand Trading – Learn about Market Movements. It is a great introduction to supply and demand trading.
Thank you for reading!